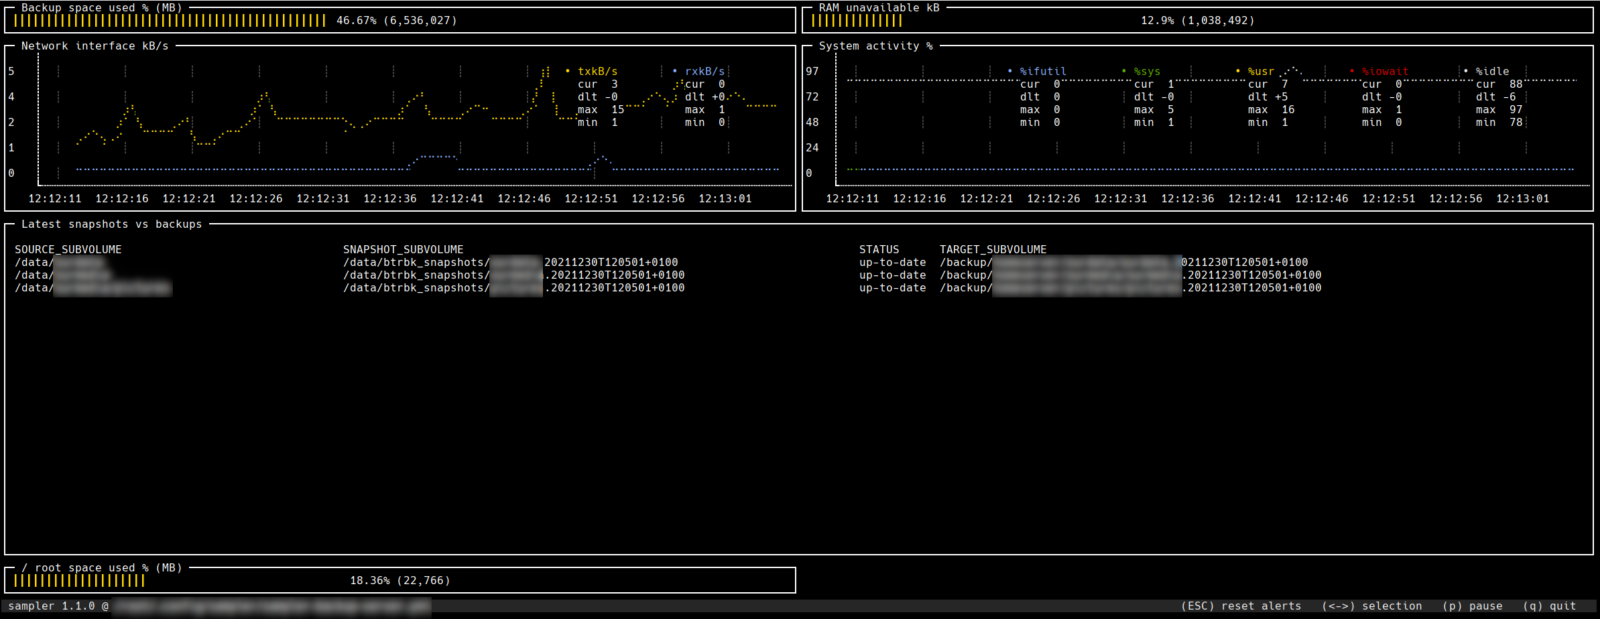
A basic sampler dashboard definition for monitoring a hardened backup server on a terminal.
Special requirements:
- btrbk, configured to backup snapshots
- sampler
sarsystat(only thesarexecutable is required, it is safe to disable thesysstatservice after installation)
The configuration file defines a 80 columns x 40 rows basic console dashboard for a backup server that uses a btrfs volume for backups, and btrbk to orchestrate the backup process. To configure the dashboard, adjust the variables at the top of the script.
How to display the dashboard, after logging in to the backup server:
sampler --config sampler-backup-server.ymlYou’ll most likely want to use its sister script sampler-file-server.yml, on the file server.
variables:
    # Configure these:
    btrbk_config: "/etc/btrbk-backup-fileserver.conf"
    mountpoint_backup: "/backup"
    network_interface: "eno1"
    tmp_dir: "/tmp"
    max_backup_usage_percent: 80 # before visual alert
    max_root_usage_percent: 66   # before visual alert

# Positions within 80x40 grid
# Colors: https://www.ditig.com/256-colors-cheat-sheet
textboxes:
  - title: "Latest snapshots vs backups"
    position: [[0, 15], [80, 23]]
    rate-ms: 60000
    sample: btrbk -c $btrbk_config --format=table list latest

  - title: systemdummy # never displayed, just for collecting data
    position: [[1000, 1000], [0, 0]]
    rate-ms: 983
    sample: LC_ALL= LC_TIME="en_DK" sar 1 1 -u ALL | tail -n 1 | tee "$tmp_dir/sarsys.tmp"

  - title: networkdummy # never displayed, just for collecting data
    position: [[1000, 1000], [0, 0]]
    rate-ms: 983
    sample: LC_ALL= LC_TIME="en_DK" sar 1 1 -n DEV --iface=$network_interface | tail -n 1 | tee "$tmp_dir/sarnet.tmp"

gauges:
  - title: "Backup space used % (MB)"
    position: [[0, 0], [40, 3]]
    rate-ms: 5000
    scale: 2
    percent-only: false
    color: 220
    # variables unavailable in trigger conditions, workaround via name pipe
    init: mkfifo backupvolume
    cur:
      sample: df --block-size=1000000 --output=used /backup | sed -e 1d -e 's/[^0-9]//g'
    max:
      sample: df --block-size=1000000 --output=size $mountpoint_backup | sed -e 1d -e 's/[^0-9]//g'
    min:
      sample: echo "$max_backup_usage_percent $mountpoint_backup" > backupvolume && echo 0
    triggers:
      - title: "Backup FS running out of space"
        # Pull mountpoint and max usage from named pipe, since variables are unsupported in conditions
        condition: BACKUP=$(cat < backupvolume) && BACKUPMOUNT=$(echo $BACKUP | cut -f2- -d' ') && BACKUPUSAGE=$(echo $BACKUP | cut -f1 -d' ') && echo "$(df --block-size=1000000 --output=used ${BACKUPMOUNT} | sed -e 1d -e 's/[^0-9]//g') * 100 / $(df --block-size=1000000 --output=size ${BACKUPMOUNT} | sed -e 1d -e 's/[^0-9]//g') >= $BACKUPUSAGE" | bc -l
        actions:
          visual: true

  - title: "RAM unavailable kB"
    position: [[40, 0], [40, 3]]
    rate-ms: 2000
    scale: 2
    percent-only: false
    color: 220
    cur:
      sample: awk '/MemAvailable/{available=$2} /MemTotal/{total=$2} END{print (total-available)}' /proc/meminfo
    max:
      sample: awk '/MemTotal/{total=$2} END{print (total)}' /proc/meminfo
    min:
      sample: echo 0

  - title: "/ root space used % (MB)"
    position: [[0, 38], [40, 3]]
    rate-ms: 5000
    scale: 2
    percent-only: false
    color: 220
    # variables unavailable in trigger conditions, workaround via name pipe
    init: mkfifo rootusage
    cur:
      sample: df --block-size=1000000 --output=used / | sed -e 1d -e 's/[^0-9]//g'
    max:
      sample: df --block-size=1000000 --output=size / | sed -e 1d -e 's/[^0-9]//g'
    min:
      sample: echo $max_root_usage_percent > rootusage && echo 0
    triggers:
      - title: "/ running out of space"
        condition: ROOTUSAGE=$(cat < rootusage) && echo "$(df --block-size=1000000 --output=used / | sed -e 1d -e 's/[^0-9]//g') * 100 / $(df --block-size=1000000 --output=size / | sed -e 1d -e 's/[^0-9]//g') >= $ROOTUSAGE" | bc -l
        actions:
          visual: true

runcharts:
  - title: "Network interface kB/s"
    position: [[0, 3], [40, 12]]
    rate-ms: 997 # slight offset to dummy data collector
    scale: 0
    legend:
      enabled: true
      details: true
    items:
      - label: "rxkB/s"
        color: 111
        sample: awk '{print $5}' "$tmp_dir/sarnet.tmp"
      - label: "txkB/s"
        color: 220
        sample: awk '{print $6}' "$tmp_dir/sarnet.tmp"

  - title: "System activity %"
    position: [[40, 3], [40, 12]]
    rate-ms: 997 # slight offset to dummy data collector
    scale: 0
    legend:
      enabled: true
      details: true
    items:
      - label: "%idle"
        color: 254
        sample: awk '/all/{print $12}' "$tmp_dir/sarsys.tmp"
      - label: "%iowait"
        color: 160
        sample: awk '/all/{print $6}' "$tmp_dir/sarsys.tmp"
      - label: "%usr"
        color: 220
        sample: awk '/all/{print $3}' "$tmp_dir/sarsys.tmp"
      - label: "%sys"
        color: 70
        sample: awk '/all/{print $5}' "$tmp_dir/sarsys.tmp"
      - label: "%ifutil"
        color: 111
        sample: awk '{print $10}' "$tmp_dir/sarnet.tmp"
Image Credits:
Papirus icon for Terminal (modified) | GNU General Public License, version 3▫ Basic sampler dashboard for a backup server | by Rolf F. Katzenberger | Licensed under Creative Commons Attribution-ShareAlike 4.0 International (CC BY-SA 4.0)
Licensing:
This content is licensed under a Creative Commons Attribution-ShareAlike 4.0 International License.
For your attributions to us please use the word »tuxwise«, and the link https://tuxwise.net.